
I recently ran into an article by Yo-Der Song and Tomaso Aste named "The cost of Bitcoin mining has never really increased". In the article they compare the daily transaction volume with the spot price of Brent oil as the basis for worldwide electricity prices. They came up with a ratio of the “cost of mining” based on this oil price and compared it to on-chain transaction volumes.
This nice little graph came out:

The authors were enticed by the idea of a neat range and assumed a correlation. This, however, is a clear case of being fooled by randomness.
The entire idea is flawed in its basis as there is no relation between the price of oil and Bitcoin production costs and the authors have just found an accidental correlation.
It got us thinking though. Is there a relation between Bitcoin transaction volumes and actual Bitcoin production costs?
It turned out that there is a fairly visible shift based on the major narratives that have been prevalent around Bitcoin. We took publicly available hashrate data, estimated transaction volume in USD and miner revenues in USD from blockchain.com. We also took the list of the most efficient miners for the given generation and assumed that the average price of electricity for a miner is 0.05 $/kWh.
In essence, the above mentioned article claims that the ratio of Bitcoin production costs based on oil price at a given time, divided by the transaction volumes at that same time, is a neat range oscillating around 0.14% (mean average lifetime total) 0.3% (mean average since 2018).
We consider the network costs to simply be the electricity costs, hardware efficiency and global hashrate (we ignore CAPEX and OPEX).
We considered more realistic assumptions. With them, the chart tells a story instead of being a single range. We annotated it inside the chart.
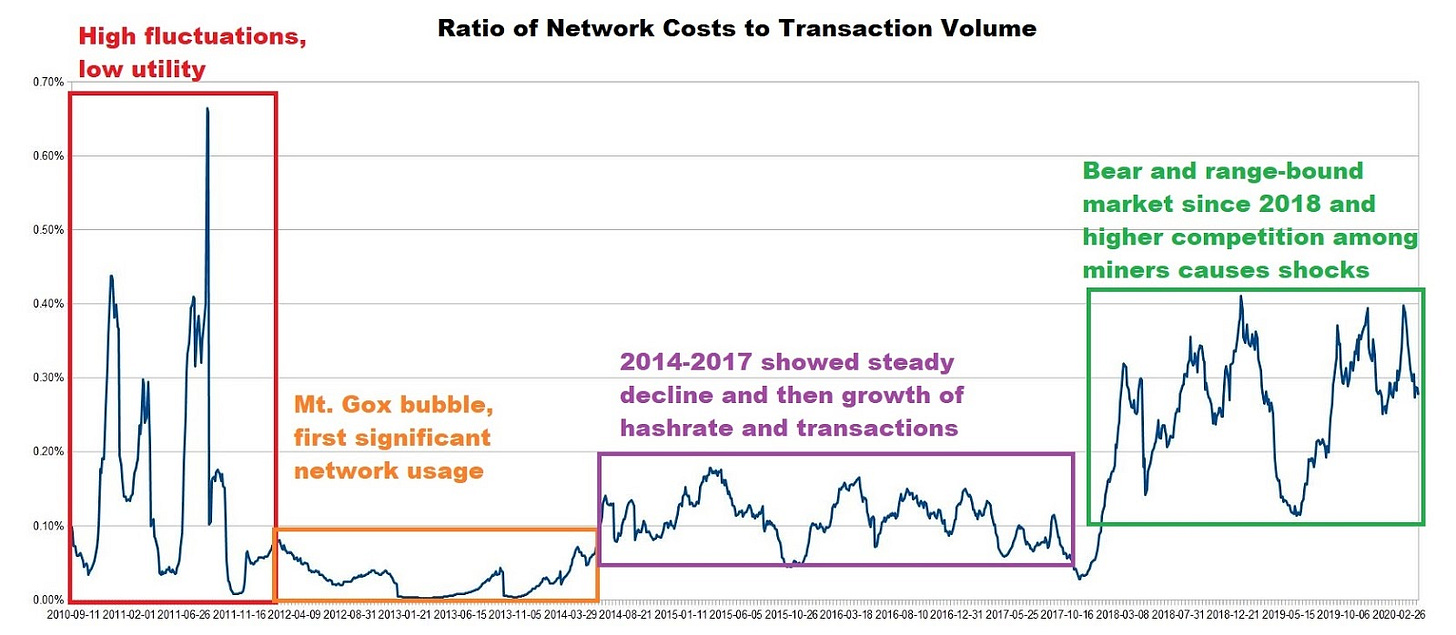
Without looking at the price since 2018, this tells us either that the Bitcoin market has been sustaining significant production cost shocks, swings in money transacted on-chain or both - which is not too useful, unfortunately.
However, flipping around the chart helps significantly, and even provides some predictive power.
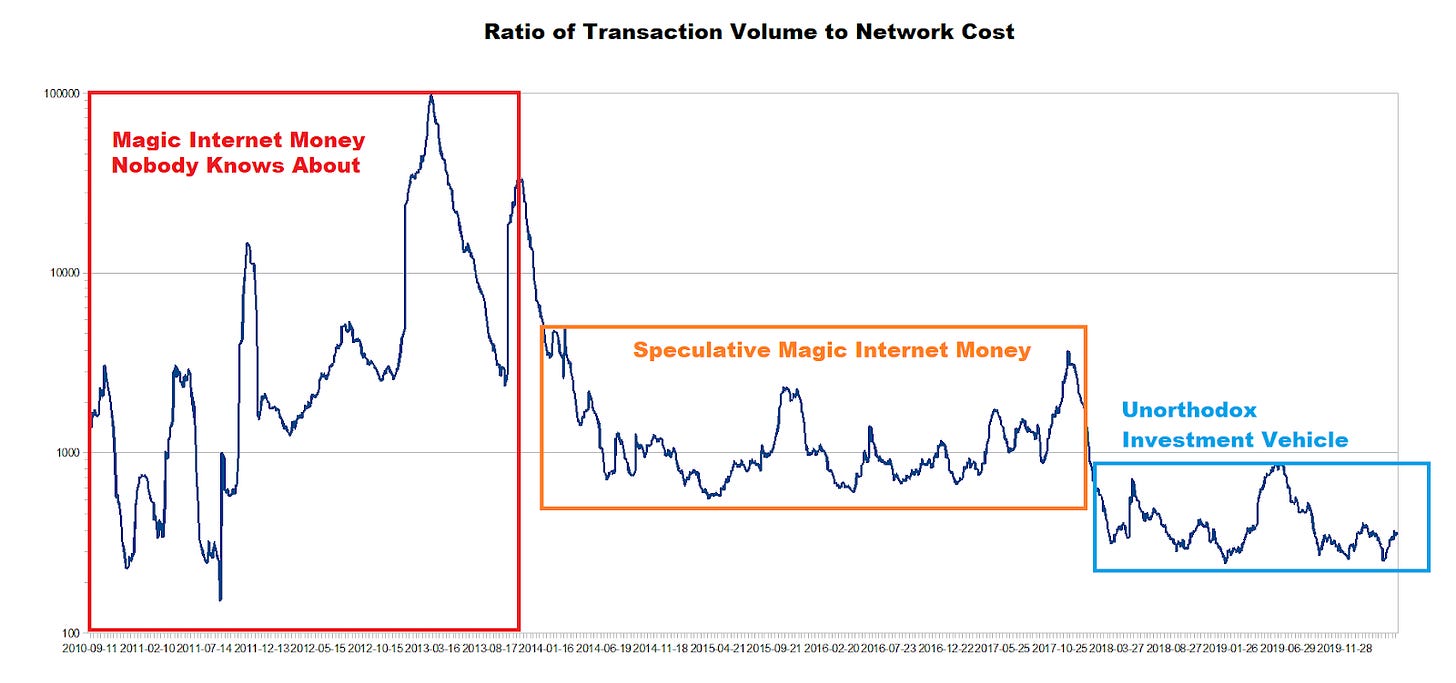
For the first three years of its existence, Bitcoin was a very obscure commodity nobody really cared about. After the first proper bubble to $1200, a vibrant speculative ecosystem (leveraged trading and altcoins) evolved around it. Transaction volumes indicate that Bitcoin has been a steady medium of exchange between both users and third parties. After the 2017 bubble, a lower plateau was found as the miner competition became more fierce, established, and industrialized. In essence the industry around Bitcoin moved up one step of the ladder to become just another financial instrument.
Another chart shows how the production costs have been growing over time compared to revenues as the mining business is becoming more commoditized:
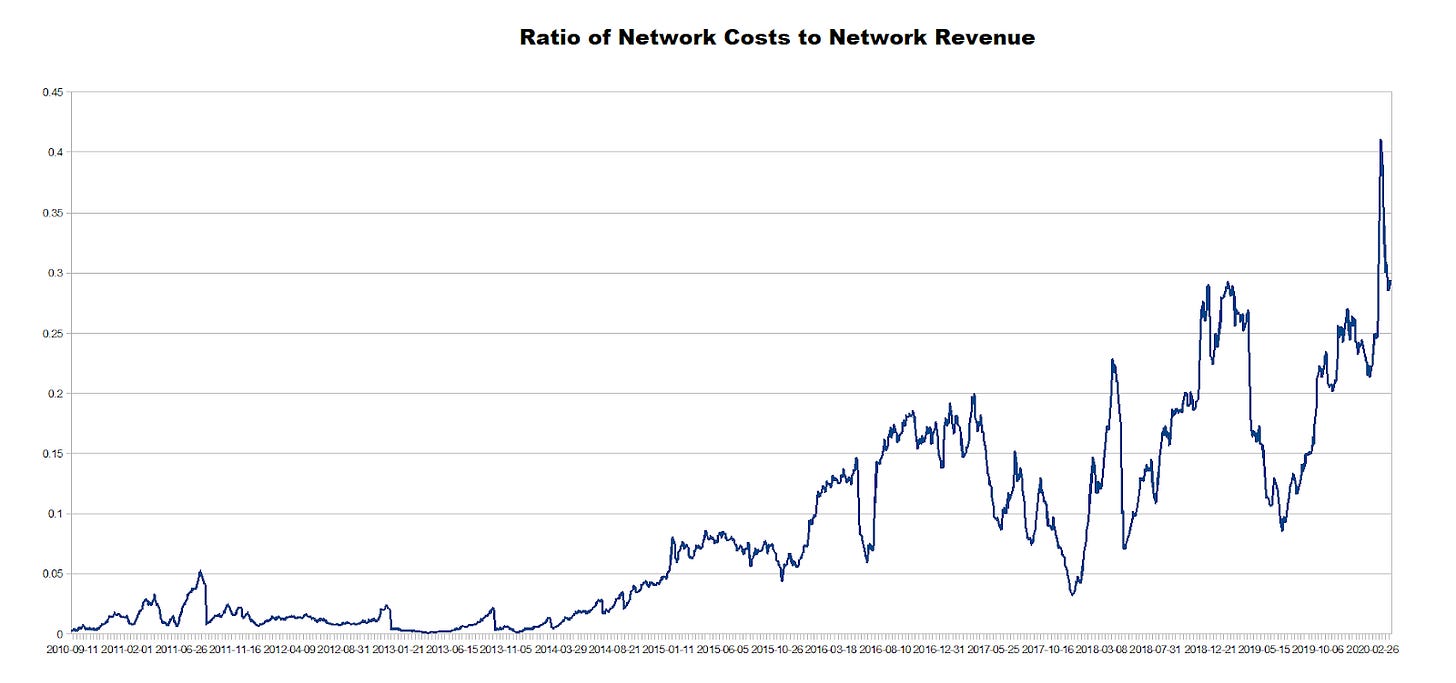
This ratio can of course never go above 1 as it would not be economic for the miners. If we were to include maintenance OPEX and CAPEX expenditure, the ratio would be much higher right now, probably closing in on 1. Because halvings exist, the Bitcoin network needs transactional volume (and user fees) to keep growing, as they are the only mechanism which can replace coinbase inflation.